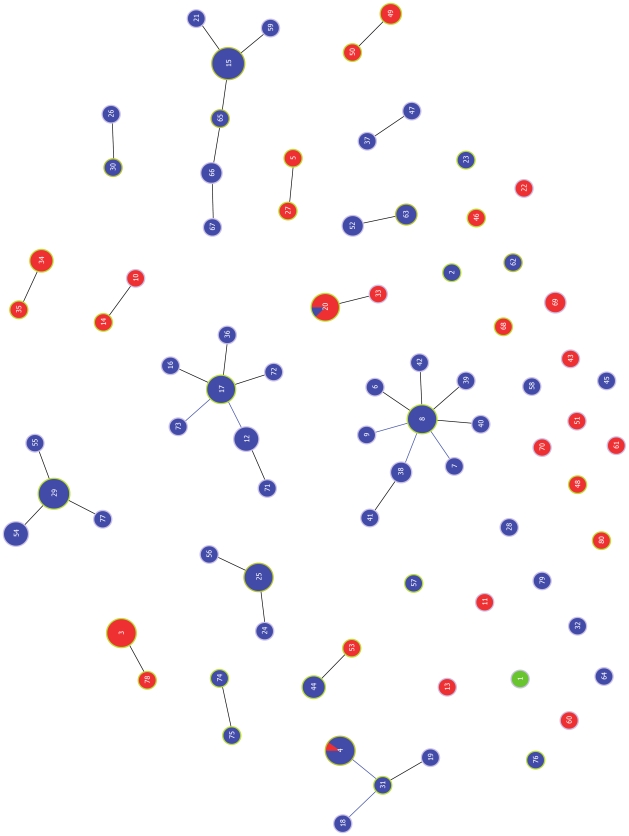
Figure 1. goeBURST diagram of relationships between 178 global SDSE isolates.
The size of each circle is proportional to the number of isolates with that particular ST in a logarithmic scale. STs assigned to the same CC are linked by straight lines. Blue circles represent isolates that have the group G carbohydrate. Red circles represent isolates expressing the group C carbohydrate. Whenever isolates of the same ST have different group carbohydrates, the number of isolates bearing the same carbohydrate is proportional to the respective color. The green circle represents the single isolate expressing the group L carbohydrate.

