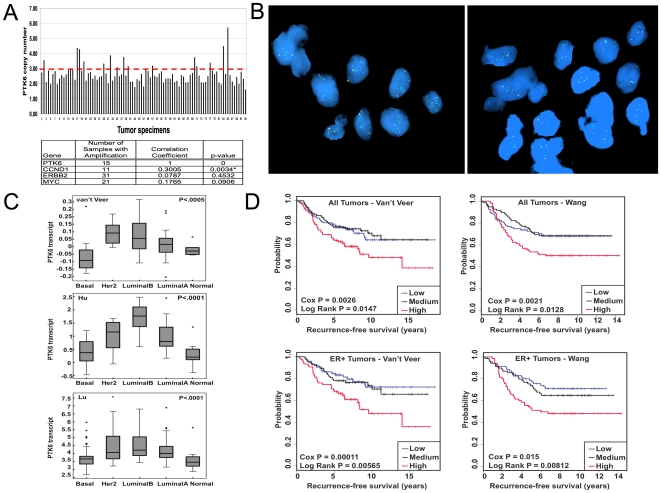
Figure 7. PTK6 copy number gain and overexpression in primary human breast tumor samples.
A) (Top) SNP array analyses of 93 breast tumors demonstrates PTK6 copy number gain in a subet of tumors.The x-axis represents individual breast tumor specimens; the y-axis represents copy number. The red line indicates copy number = 3 (Bottom) Correlation analysis with other amplified genes is shown. The table lists the number of tumors with PTK6 copy number gain (copy number≥3.0), the Pearson product-moment correlation for each pair of variables and the associated P-values. B) FISH analysis demonstrates PTK6 copy number gain. Two human breast tumors were selected for FISH analyses based on high PTK6 transcript expression levels in microarray analyses. FISH analysis was performed using a probe specific for PTK6 (green) or a control chromosome 20 centromeric probe (pink). C) PTK6 mRNA is differentially expressed in human breast cancer subtypes. Publicly available datasets were used to compare levels of PTK6 mRNA in breast cancer subtypes (basal, HER2/ERBB2+, Luminal A, Luminal B) and normal samples. P-values were calculated using ANOVA in JMP 7.0 software. D) PTK6 mRNA level is a predictor of prognosis in human breast cancer. Kaplan-Meier curves depict the probability of breast cancer recurrence based on relative levels of PTK6 transcript expression. Probabilities for the entire cohort (top) as well as the ER+ subgroup (bottom) were determined. The Cox regression test evaluates the association of PTK6 level with patient outcome treating the level of PTK6 as a continuous variable. The log-rank test evaluates whether there are significant differences between any of the three groups. Data sets from Van't Veer et al. (Van't Veer et al., 2002) and Wang et al.(Wang et al., 2005) were analyzed.

