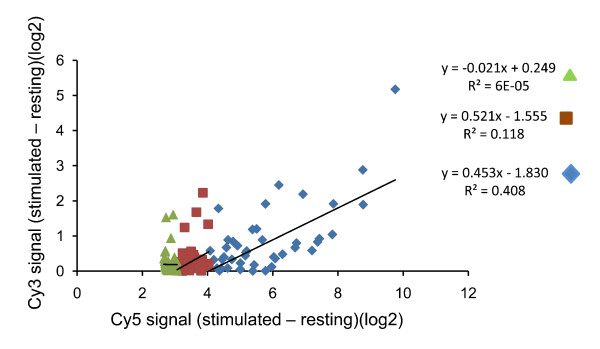
Figure 3.
Interference between Cy3 and Cy5 sample signal. Loess normalised log2 data obtained from a sample of RNA from unstimulated macrophages was subtracted from data from a sample of RNA from macrophages stimulated with IFNβ. The differences in signal in the Cy3 channel are plotted against the equivalent differences in Cy5 channel. The plot shows data for all genes showing a difference (i.e. stimulation index) of >4 log2 units (blue), those genes showing a difference of 3-4 log2 units (brown) and those genes showing a difference of 2.5-3 log2 units. The linear regression line and correlation coefficient for each set of genes was analysed separately.

