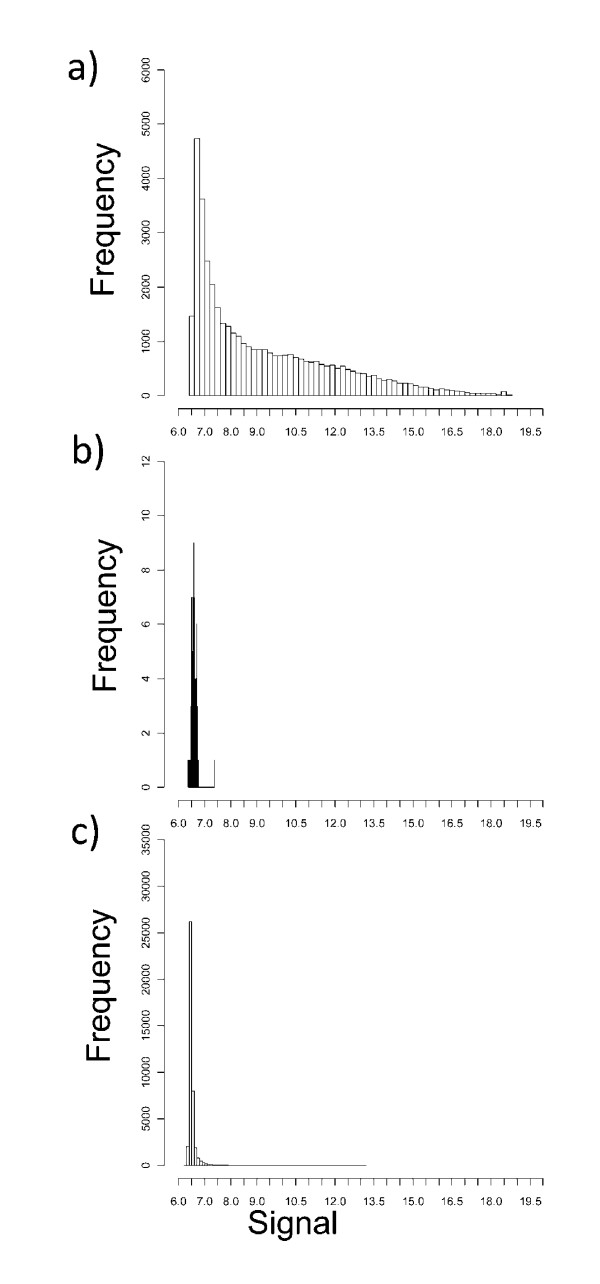
Figure 4.
Log signal frequency distributions. a) Frequency distribution of the Loess normalised log Cy5 signal of all 41,001 probes from one representative macrophage array. b) Frequency distribution of the Loess normalised log Cy5 signal from the "background" probe (labelled (-)3 × SLv1) for all 96 arrays. c) Frequency distribution of the mean log Cy5 signal for all 41,001 probes from three Arabidopsis samples.

