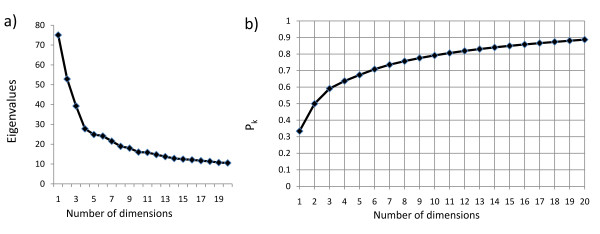
Figure 6.
Chosing the dimensionality of MDS. The Loess normalised log2 data for the Cy5 (experimental) channel for all 77 arrays was analysed as described in the text. a) A plot of the first twenty Eigenvalues as calculated by the mdscale package. b) A plot of goodness of fit value Pk for 1 - 20 dimensions.

