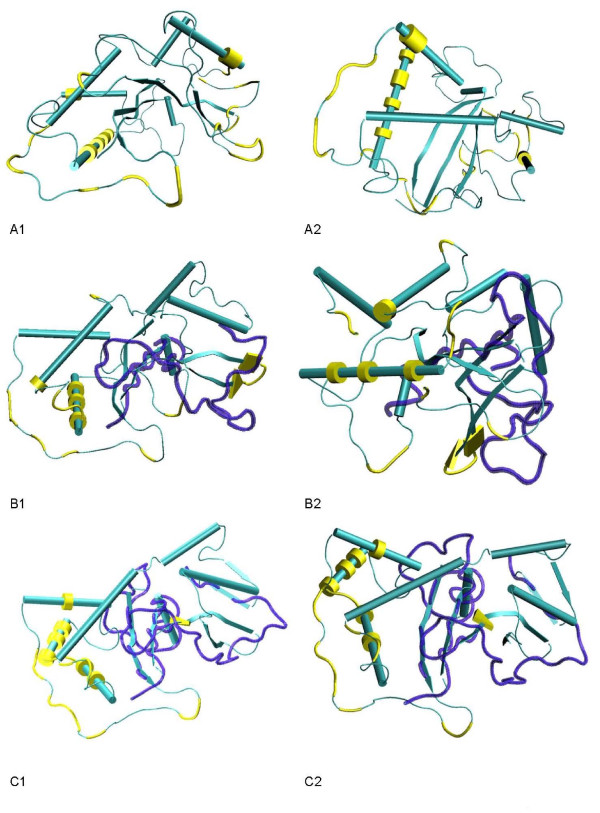
Figure 3.
Two views of the distribution of positively selected amino acid sites on the S-RNase crystal structure. The Pyrus pyrifolia (Rosaceae; 1IQQ) structure is shown when using the Maloideae (Rosaceae) (A1, and A2) and Prunus (Rosaceae) (B1, and B2) datasets, while the Nicotiana alata (Solanaceae; 1IOO) structure is shown when using the Solanaceae dataset (C1, and C2). Alpha helices are represented as tubes and beta-sheets as thin sheets. Positively selected sites are highlighted in yellow. Regions marked in blue correspond to those regions of the S-RNase protein that were not inspected for the presence of positively selected amino acid sites [12].

