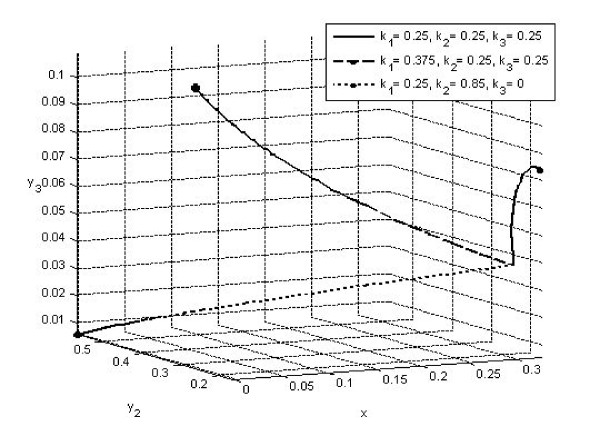
Figure 5.
Simulation for the cases of row 1 (solid blue trajectory approaching E*) and row 2 (dash green trajectory approaching EB3 ) in Table 1, and row 2 (dotted red trajectory approaching EB1) in Table 2, where initial fractions for all three trajectories are (x(0), y2(0), y3(0)) = (0.3,0.17,0.04).

