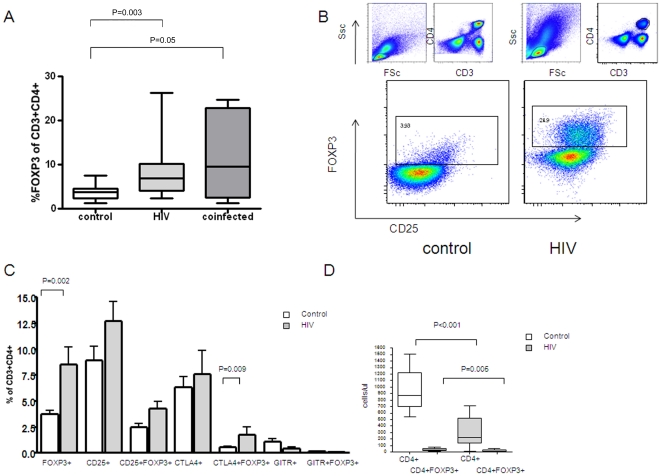
Figure 1. FOXP3 expression at baseline in HIV infected patients.
Panel A: Subgroup analysis of the HIV and HIV/TB coinfected groups showed no difference in FOXP3 expression as a percentage of CD3+CD4+ T lymphocytes between the HIV and HIV/TB co-infected groups. Panel B: Representative plots of baseline FOXP3 expression in CD3+CD4+ lymphocytes plotted against CD25 for a control and an HIV positive sample. Panel C: Expression of FOXP3, CD25, CTLA-4 and GITR as a percentage of the CD3+CD4+ population. Panel D: Absolute numbers of total and FOXP3 expressing CD4+ T cells at baseline.

