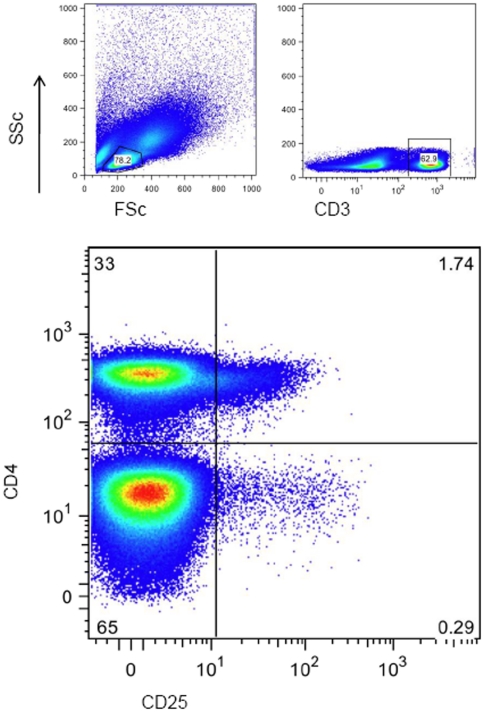
Figure 2. Representative plot illustrating CD25 gating strategy.
Lymphocytes were gated according to forward and side scatter. CD3 positive lymphocytes were selected. CD25 expression on the x-axis was plotted against CD4 on the y-axis. A gate was set according to CD25 expression on the CD4− population. This gave a percentage of CD3+CD4+CD25+ lymphocytes as a percentage of CD3+ (figure in top-right quadrant). This percentage was then used to calculate the percentage of CD3+CD4+CD25+ lymphocytes as a percentage of the CD3+CD4+ population (CD4 population being top-left and right quadrants added together).

