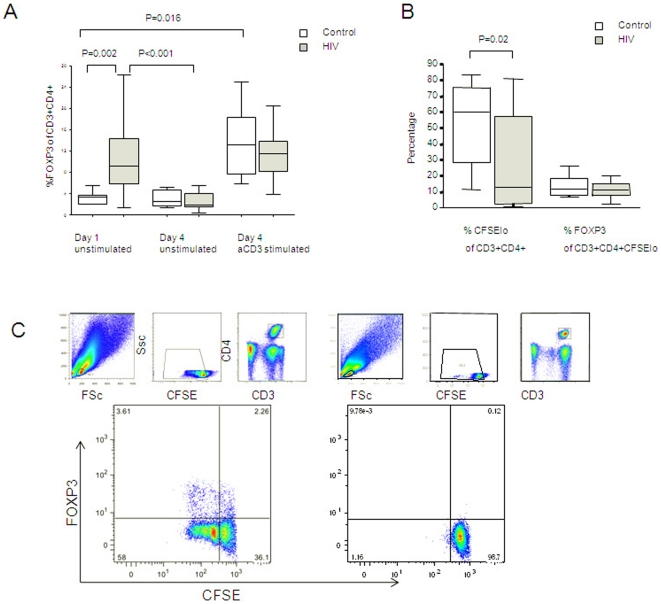
Figure 4. FOXP3 expression after T cell receptor stimulation.
Panel A: FOXP3 expression as a percentage of T lymphocytes at baseline and after 4 days of cell culture, with and without T cell receptor stimulation with anti-CD3. Panel B: Proliferation of total CD4+ T cells and FOXP3+ expression in proliferated CD4+ T cells following T cell receptor stimulation with aCD3. Panel C: Representative plot of FOXP3+ expression in proliferated T cells (left-hand plot) following anti-CD3 stimulation compared with an unstimulated sample(right-hand plot). The small plots above show ancestry – lymphocytes were gated; followed by exclusion of events with high CFSE; followed by selection of CD3+CD4+ T cells. Proliferation is demonstrated by halving of CFSE fluorescence in cells that have divided (large plots below). In the anti-CD3 stimulated sample, FOXP3 expression is noted in cells which have proliferated (top-left quadrant) as well as those that have not proliferated (top-right quadrant).

