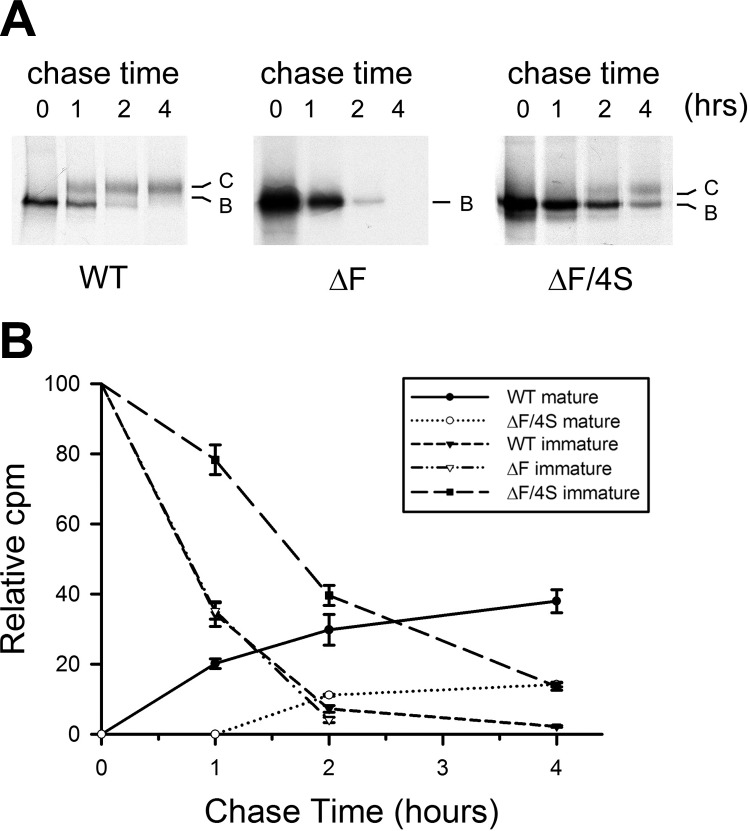
Figure 2.
Metabolic labeling of CFTR. Stable BHK cells overexpressing WT-CFTR and ΔF508-CFTR with and without 4 suppressor mutations (I539T/G550E/R553M/R555K, ΔF/4S) were pulse labeled with 100 μCi/ml [35S] methionine for 20 min, followed by 0, 1, 2, and 4 h chase. CFTR was immunoprecipitated with mAb596 conjugated to protein A beads and separated with 6% SDS-PAGE. Gels were fixed and dried before exposed to film (A) and quantified by electronic autoradiography (B). Data are presented as percentage of band B and C at a given time point during the chase relative to total labeled B band at time 0 (n=3).

