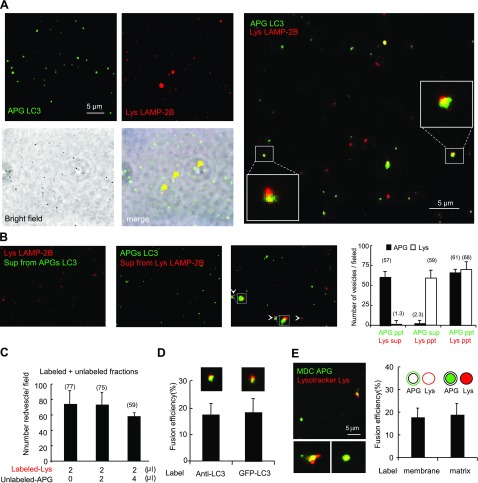
Figure 2.
Reconstitution of APG-lysosome fusion. A) Overlapping of bright field and merged fluorescent channels of mouse liver APGs and lysosomes (Lys) labeled as in Fig. 1C and incubated in fusion buffer. Right panel insets: higher-magnification images of fusion events. B) Negligible exchange of antibodies during the fusion reaction. Similarly labeled APG and lysosomes were incubated separately in fusion buffer, and after centrifugation their supernatants (sup) were collected and incubated with labeled lysosomes (left panel) and labeled APGs (left middle panel). Incubation in parallel with the originally labeled fractions is shown as a positive control of fusion (right middle panel). Graph (right panel) shows number of green or red vesicles per field in each of the three reactions. Values are also shown at top of respective bars. C) LAMP-2B-labeled lysosomes were incubated alone or with two different concentrations of unlabeled autophagosomes for 30 min at 37°C. Total number of red particles per field at the end of each of the incubations was quantified. D) Percentage of fusion events between lysosomes labeled with anti-LAMP-2B and APGs either labeled with anti-LC3 or isolated from GFP-LC3 transgenic mice. Values are expressed as percentage of fusion events relative to the total number of particles in the field. E) Fusion events between APGs and lysosomes isolated from cells previously incubated with MDC and with LysoTracker, respectively. Left panel: representative fluorescent image. Insets: examples of fusion events at higher magnification. Right panel: percentage of fusion events between vesicles labeled with antibodies against membrane proteins (as in A) or vesicles with fluorescent content. Values are expressed as in E. All values are means + se of 3 different experiments.

