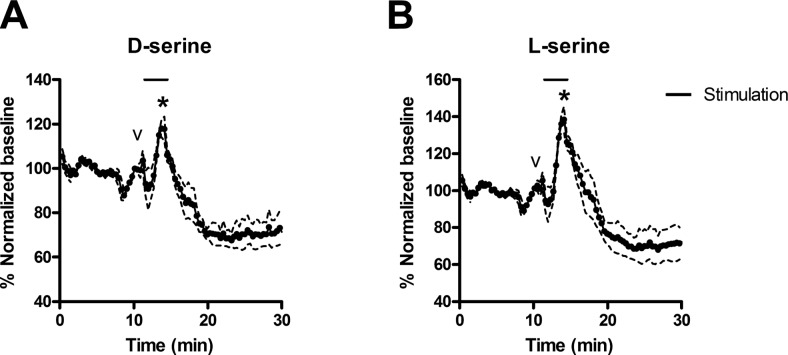
Figure 10.
Effect of veratridine on extracellular d- and l-serine concentrations in rat striatum. Online MD-CE was used to monitor d-serine (A) and l-serine (B) concentrations in rat striatum. CE analyses were performed every 22 s. Black bar denotes the 3-min period (corrected for time to travel to the detector) where aCSF perfusing the probe was changed to aCSF spiked with 100 μM veratridine. Smaller peak (indicated by v) is an artifact that occurs when the valve is switched to introduce the drug-containing aCSF into the line. Larger peak (indicated by asterisk) corresponds to veratridine-induced d-or l-serine release. Dashed lines mark se of 3 replicate measurements.

