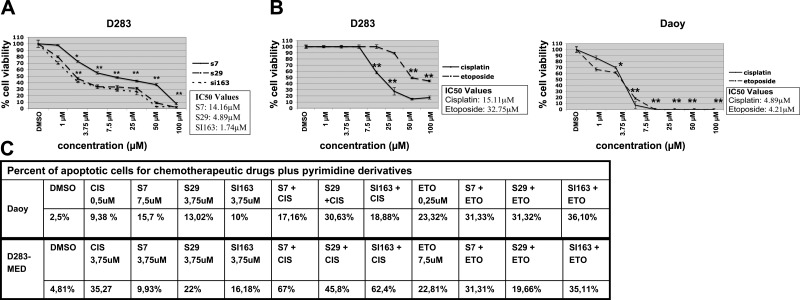
Figure 5.
A) Inhibition curves for S7, S29, SI163 in D283-MED cells. B) S7, S29, and SI163 show major effects in medulloblastoma cell proliferation compared to cisplatin and etoposide. Data are representative of ≥2 independent experiments. Error bars = sd from mean values. C) PI supravital exposure was performed in untreated cells and treated with pyrimidine derivatives alone and in combination with chemotherapeutic agents, for 48 h. Percentages of apoptotic cells are reported for each representative time point. *P < 0.05; **P < 0.01.

