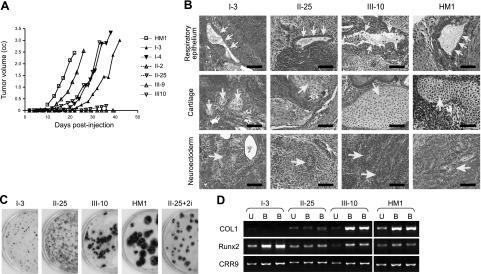
Figure 3.
Characterization of differentiation potentials of reprogrammed cells. A) Kinetics of teratoma development following subcutaneous injection of cells into nude mice. Each clone was injected at 2 subcutaneous sites (106 cells/site). Once palpable, the volume of each tumor (length × breadth × thickness) was measured using calipers every 3 or 4 d. Data are from 1 injection site of each cell type. The other site differed in absolute tumor volume, but kinetics was the same. MEFs were injected as control, which did not develop any tumors (data not shown). B) Histological analysis of teratomas derived from reprogrammed cells. Tumors were removed about 1 mo postinjection and subjected to H&E staining. Respiratory epithelium (top panels), immature cartilage (middle panels), and neuroectoderm (bottom panels) represent differentiated cells that belong to the 3 germ layers, endoderm, mesoderm, and ectoderm, respectively. All images were photographed at ×400. Arrows indicate respective tissues as labeled at left. Scale bars = 100 μm. C) Osteogenic differentiation of reprogrammed cells. Differentiated bone colonies formed under osteogenic culture conditions were stained dark brown with silver nitrate in 6-cm plates, whereas nonbone colonies were counterstained with methylene blue. II-25+2i, II-25 cells treated with CHIR99021 and U0126 for 4 wk (see Fig. 6). D) Expression of osteogenic markers, as analyzed by RT-PCR. U, undifferentiated cells; B, bone colony; COL1, type I collagen.

