Figure 1.
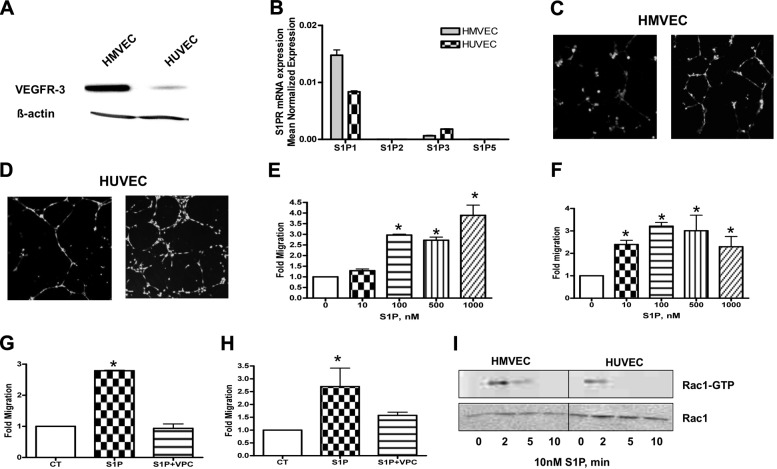
S1P induces migration and tube formation of HMVECs and HUVECs through the S1P1 receptor. A) HMVECs and HUVECs were collected for Western blot. Membranes were probed with the following antibodies: VEGFR3 (1:1000) and actin (1:10,000) as a loading control. B) Cells were subjected to mRNA extraction and real-time PCR analysis for S1P1–5 receptors. Real-time PCR data are expressed as mean normalized expression, using β-actin as a reference gene, and are presented as means ± sd of 3 independent experiments. C, D) HMVECs (C) and HUVECs (D) loaded with the fluorescent cell tracker CMFDA were seeded on Matrigel-coated 24-well dishes and incubated in EGM + 0.1% BSA (CT) or EGM + 0.1% BSA containing 100 nM S1P for 4 h. Photos are representative images of 3 independent experiments performed in quadruplicate. E, F) HMVECs (E) and HUVECs (F) loaded with the fluorescent cell tracker CMFDA were trypsinized and placed on the upper chamber of BD falcon Fluoroblok. Lower compartments were filled with increasing concentrations of S1P (0–1000 nM). After 4 h, the plate was read from the bottom in a fluorescent plate reader at excitation/emission wavelengths of 490/520 nm. Migratory ability was calculated as a percentage of control (no chemoattractant in bottom compartment). G, H) HMVECs (G) and HUVECs (H) loaded with the fluorescent cell tracker CMFDA were trypsinized and placed on the upper chamber of BD falcon Fluoroblok. Lower compartments were filled with EGM + 0.1% BSA (CT), EGM + 0.1% BSA + 100 nM S1P, or EGM + 0.1% BSA + 100 nM S1P + 1 μM VPC23019. I) Cells were incubated with 100 nM S1P for indicated times, and amounts of GTP-bound and total Rac1 were detected by immunoblotting. Representative images of 3 independent experiments are shown. *P < 0.05.

