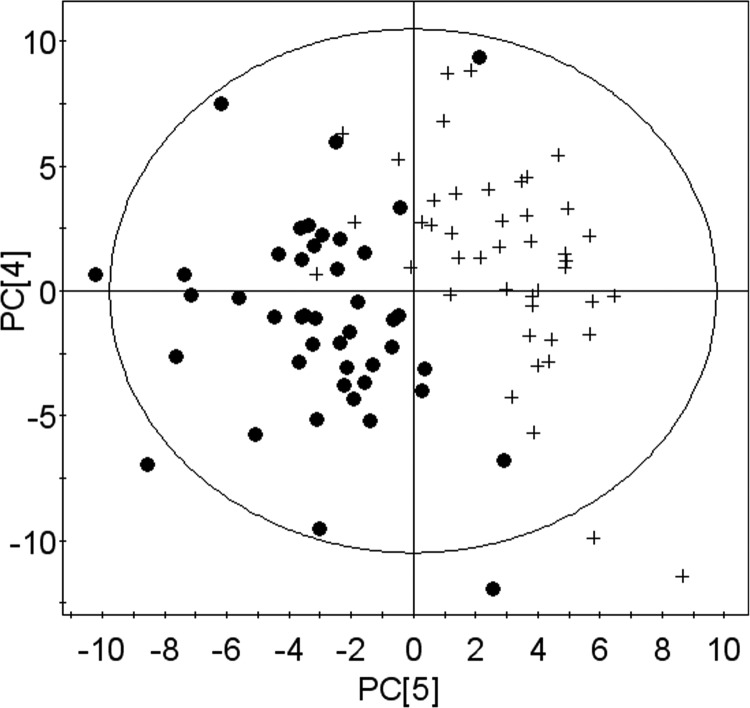
Figure 3.
PCA of metabolomic profiles separates values at end of depletion period from values at baseline. Samples were obtained and analyzed as described in Fig. 1. PCA results in a good separation of baseline values (solid circles) and depletion values (plus signs).

