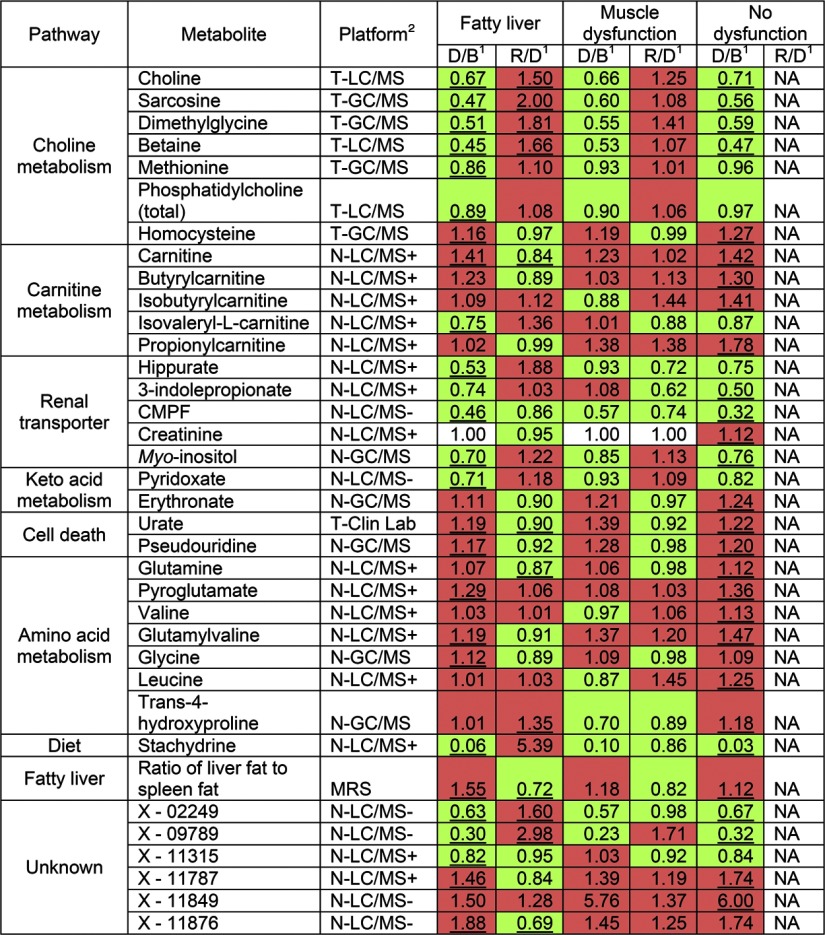
Figure 4.
Metabolites that significantly changed in intensity after choline depletion in ≥1 organ dysfunction group. Human subjects were fed diets with choline, then deprived of choline, and then repleted with choline, as described in Fig. 1. Some of the subjects developed organ dysfunction (liver or muscle) when deprived of choline. Plasma samples were collected at the end of each diet period and analyzed by targeted and nontargeted biochemical assays. All named metabolites that changed significantly with FDR adjusted P < 0.05 in ≥1 organ dysfunction group are shown. Only the most significantly changed (FDR adjusted P<0.001) unknown metabolites (not identified with an authentic standard) are shown. Spectra information of these unknown metabolites is provided in Table 2. 1Fold change between depletion and baseline (D/B) and between repletion and depletion (R/D) are shown, with significant changes (FDR adjusted P<0.05) underscored. Fold change that indicates an increase by choline depletion or repletion is shaded red; change that indicates a decrease is shaded green. NA, not performed. 2Analytical platforms used for analyses are indicated by the following abbreviations: T-GC/MS, targeted GC/MS; T-LC/MS, targeted LC/MS; T-Clin Lab, targeted clinical laboratory; N-LC/MS+, nontargeted LC/MS-positive ionization; N-LC/MS−, nontargeted LC/MS negative ionization; N-GC/MS, nontargeted GC/MS; MRS, magnetic resonance spectroscopy.

