Figure 3.
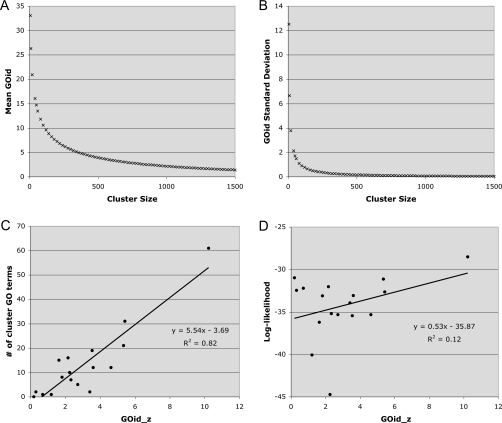
The GOid_z score as a summary of functional enrichment of clustered genes. For random clusters, the mean GOid and standard deviation were inversely correlated with the number of genes per cluster. Thus, the GOid mean (a) and standard deviation (b) were calculated for 1000 random clusters and used to determine a z-score for the GOid for each REMc cluster. (c) For REMc clusters, a positive correlation was found between GOid_z and the number of enriched GO terms for each cluster, as calculated by GTF. (d) To investigate the complementary nature of the REMc LL and GOid_z score for mining gene interaction data, LL and GOid_z were plotted for all clusters; see text for discussion.

