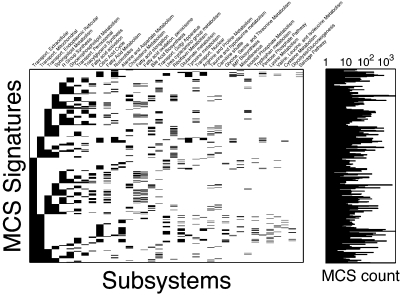
Figure 8.
Membership map depicting subsystem signatures for MCSs identified in this study and corresponding histogram for each. The sparsity pattern of each row in the map represents a unique combination of subsystems, and the histogram on the right depicts how many MCSs exist with that given signature.

