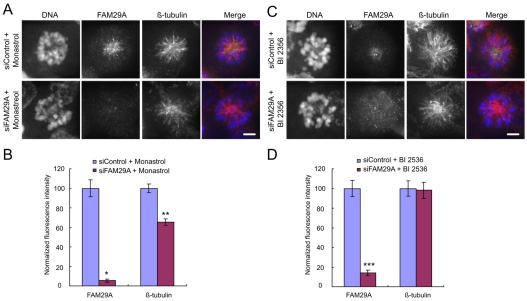
Fig. 6.
Plk1 regulates FAM29A. (A-D) HeLa cells were transfected with siRNAs, treated with monastrol (100 μM) for 4 hours, and then analyzed (A,B). Alternatively, siRNA-transfected cells were treated with monastrol (100 μM) for 2 hours and then with monastrol (100 μM) plus BI 2536 (300 nM) in DMSO for 2 hours (C,D). (A,C) Maximum projections from deconvolved z-stacks of representative cells stained for FAM29A (green), β-tubulin (red) and DNA (blue) are shown. Fluorescence intensities of total FAM29A and total β-tubulin were quantified, normalized to those in their respective control samples, and then plotted (n=10 mitotic cells for each quantification; B,D). *P<0.004; **P<1.5×10⁻⁷; ***P<9.9×10⁻⁵ (two-tailed t-test relative to siControl cells). Error bars indicate s.e.m. Scale bars: 5 μm.

