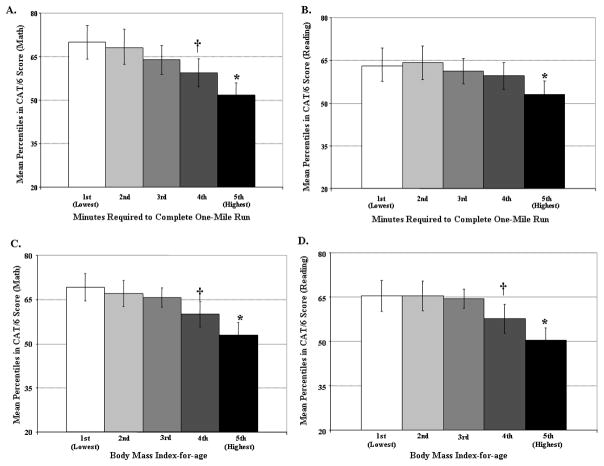
Figure 1.
CAT6 mean scores, adjusted by the covariates sex, free and reduced price lunch eligibility, and ethnicity. A, Percentiles in CAT6 score (math) by quintiles of minutes to complete mile run; * 3rd quintile of mile time differed on 2002 CAT6 math score from 1st quintile, z = −3.33, p = .001; ** 4th quintile of mile time differed on 2002 CAT6 math score from 1st quintile, z = −5.86, p < .0001; ** 5th quintile of mile time differed on 2002 CAT6 math score from 1st quintile, z = −8.41, p < .0001. B, Percentile in CAT6 score (language) by quintiles of minutes to complete mile run. * 4th quintile of mile time differed on 2002 CAT6 language score from 1st quintile, z = −2.65, p = .008; ** 5th quintile of mile time differed on 2002 CAT6 language score from 1st quintile, z = −5.07, p < .0001. C, Percentiles in CAT6 score (math) by BMI quintile; *4th quintile of BMI differed on 2002 CAT6 math score from 1st quintile, z = −2.40, p = .016; ** 5th quintile of BMI differed on 2002 CAT6 math score from 1st quintile, z = −4.02, p <.0001. D, Percentiles in CAT6 score (language) by BMI quintile. *5th quintile of BMI differed on 2002 CAT6 language score from 1st quintile, z = −2.35, p = .019. Error bars are 95% Confidence Intervals.

