Figure 3.
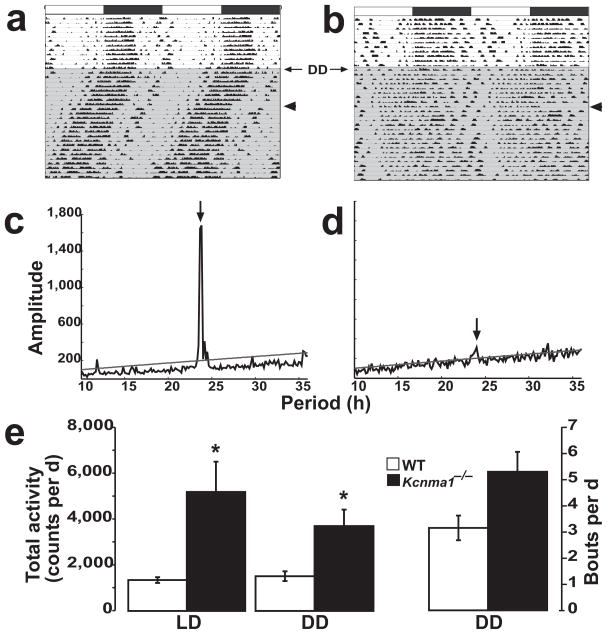
Home-cage activity records. (a,b) Activity of FVB/NJ wild-type (a) and Kcnma1−/− (b) mice was measured by motion sensors for 10 d in the light-dark condition and for 28 d in constant darkness (shaded area). Actograms are plotted as in Figure 2. Arrowheads indicate a 3-d gap in the data. (c,d) χ2 periodograms for wild-type (c) and Kcnma1−/− (d) mice, plotted from the activity data. The dominant peaks are at 23.71 h and 24.00 h, respectively. The line denotes the 0.001 confidence interval. (e) Averaged summed total activity per day ± s.e.m. for wild-type and Kcnma1−/− mice in light-dark and constant darkness conditions (left axis). Average daily activity bouts in constant darkness (right axis), defined as a continuous 60-min period during which the activity stayed above 4 counts per min. *P < 0.05.

