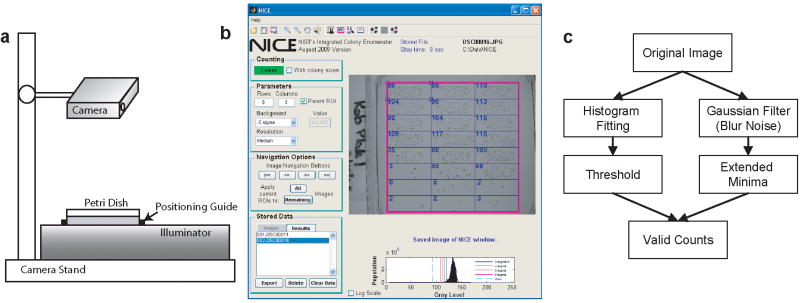
Figure 1.
a) A schematic of an imaging station using a digital camera. The camera was positioned so that the Petri dish barely filled the view field. A positioning guide enabled fast placement of plates. b) Example of the NICE after an image. Displayed is an image with 24 ROIs with minor position adjustments. Counts for each ROI are displayed in blue. c) General procedure used to count colonies in NICE. The threshold is calculated dynamically for each image. Minima are compared with this threshold to determine their validity.

