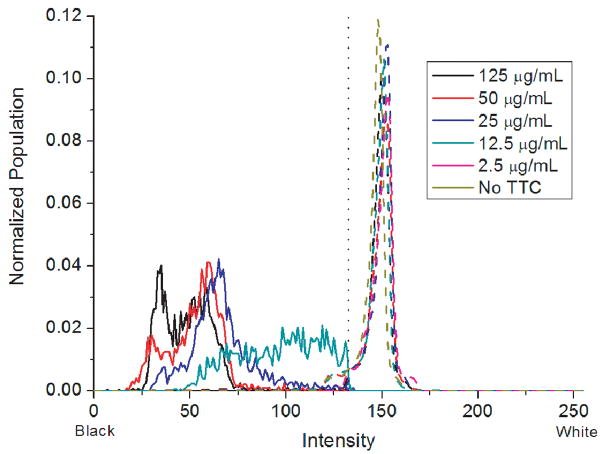
Figure 2.
Histograms of the mean intensities of colony minima (solid lines) and histogram of the entire plate (dashed lines) as a function of TTC concentration. The threshold line of the Gaussian center minus 5σ is displayed as a dotted line. Colonies stained with 2.5 μg/mL TTC or no TTC did not possess a significant contrast and are not presented here for clarity. A minimum TTC concentration of 25 μg/mL is required for high contrast between the background and colonies. TTC concentration has no significant effect on the histogram of the background intensities.

