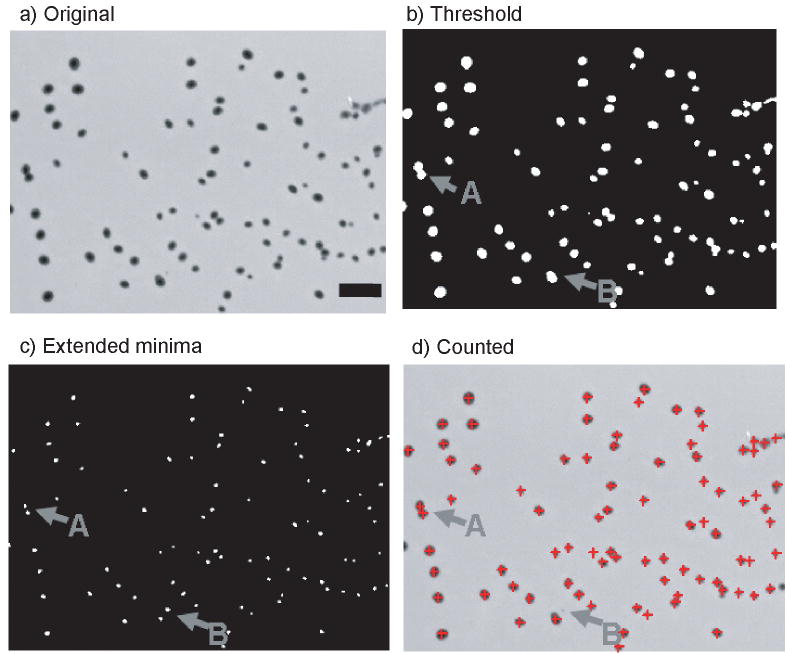
Figure 4.
Illustration of the colony counting procedure. a) The initial image has many colonies present. b) A thresholded image is shown as an example. The threshold was determined by using the Gaussian center minus 5σ. During analysis the threshold image is never explicitly calculated, but is shown here to foster understanding. c) The extended minima of the original image are shown. The white spots indicate the centers of the colonies. d) The counted colonies are presented with a red crosshair indicating a valid colony. Scale bar is 1.0 mm.

