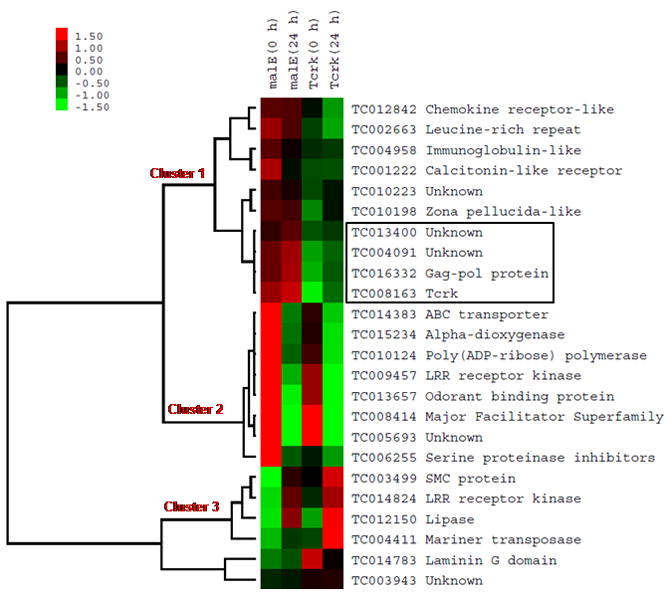
Fig. 6. Hierarchical cluster analysis of gene expression.

Eighteen down-regulated genes and six up-regulated genes were selected from microarray data for the hierarchical cluster analysis. The expression data were logarithm transformed and grouped using hierarchical clustering algorithm in Gene Cluster 3.0 program. Heat-map was generated using Java Treeview program. Genes down-regulated by Tcrk RNAi were grouped into cluster 1 and 2, while genes up-regulated by Tcrk RNAi were grouped into cluster 3. The expression of cluster 1 genes is similar between 0 h and 24 h AEP. In contrast, the expression of cluster 2 genes is much higher at 0 h AEP stage when compared to the expression at 24 h AEP stage. Three genes were clustered with Tcrk, which indicates that they have similar expression pattern (enclosed in a square).
