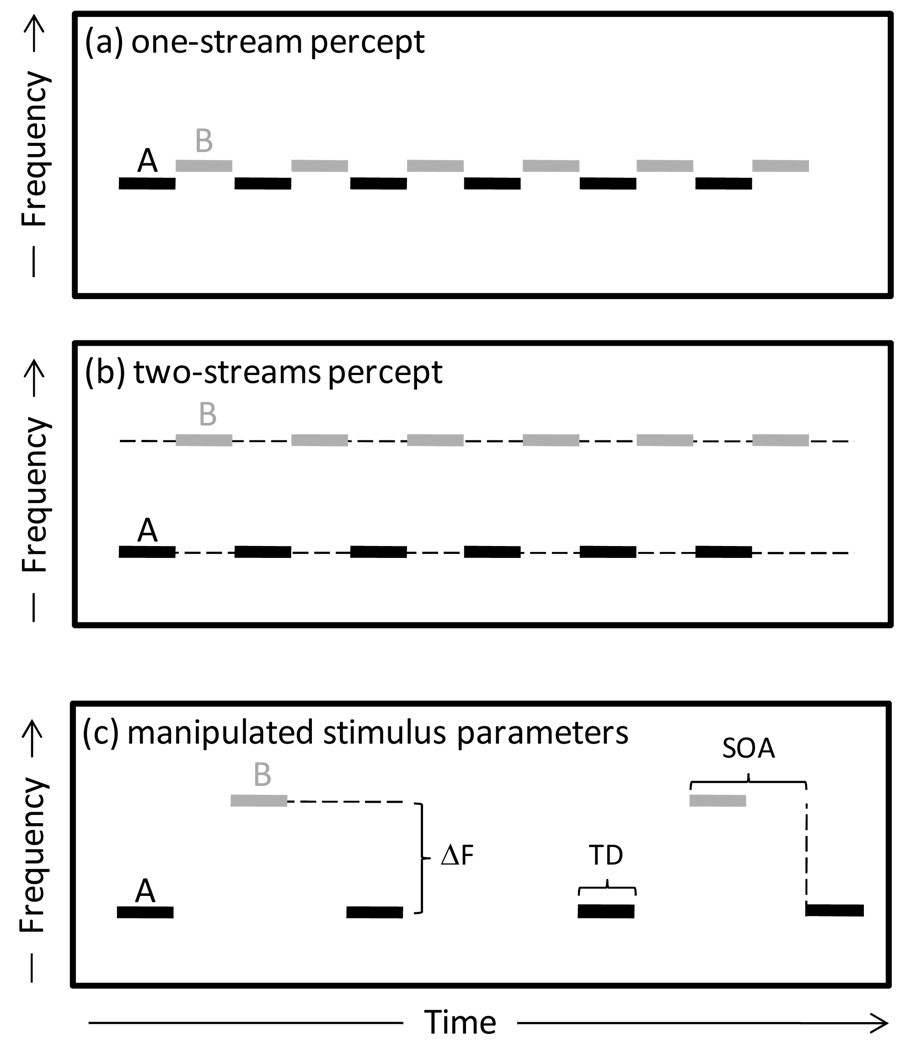
Fig. 1.
Auditory stream segregation. (a–b) Schematic diagram illustrating how a sequence of two interleaved tones differing only in frequency (A and B) can be perceived as either one stream (a) or two streams (b) depending on the degree of frequency separation (ΔF) between them. (c) Depiction of the three stimulus parameters manipulated in this study, including the frequency separation between the A and B tones (ΔF, in semitones), the stimulus onset asynchrony (SOA), defined as the time between the onset of two consecutive tones within a triplet, and the tone duration (TD).

