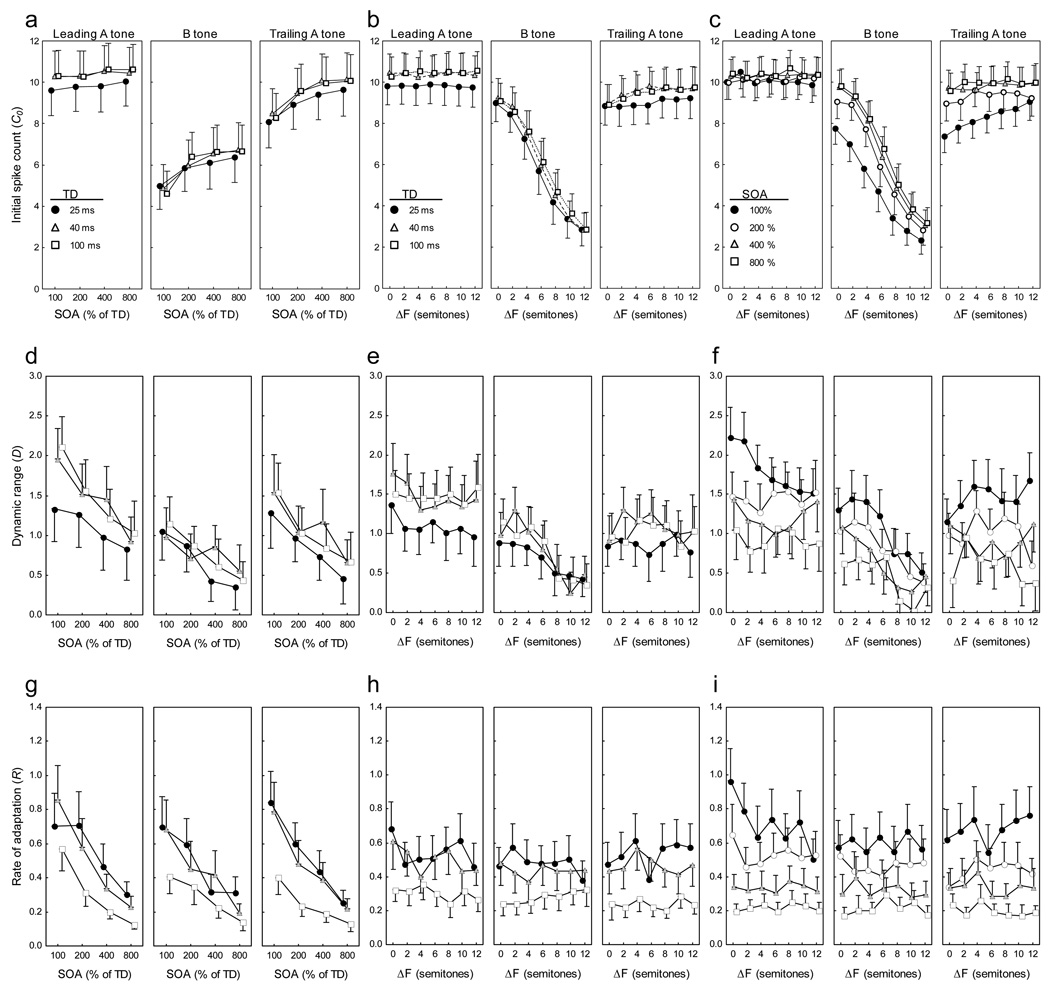
Fig. 4.
Factors affecting responses to ABA- triplets. Shown are the mean (± s.e.m.; N = 46) fitted values for (a–c) initial spike counts (C0), (d–f) dynamic range (D), (g–i) and the rate of adaptation (R). The left column of plots shows values as functions of stimulus onset asynchrony (SOA), with tone duration (TD) as the parameter. The middle column of plots depicts values as functions of frequency separation (ΔF), with TD as the parameter. The right column of plots depicts values as functions of ΔF, with SOA as the parameter. Model parameters are based on a using a 20-ms analysis window to quantify spike counts across triplets in the various conditions.

