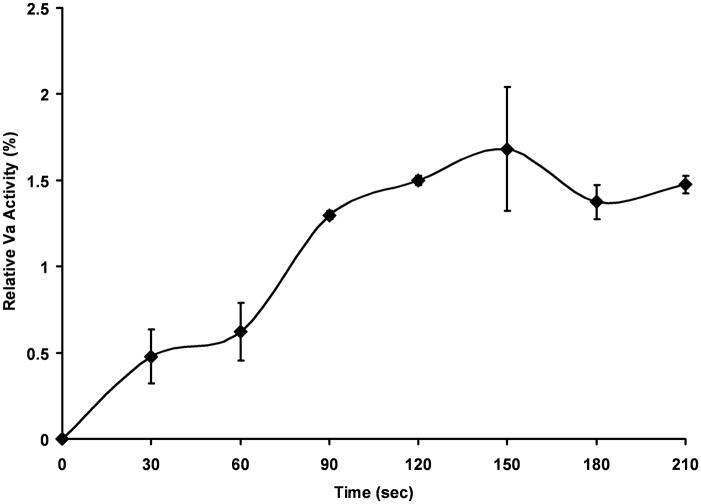
Figure 4. FXIa proteolysis of fV: activity analysis.
Human fV (1.5 nM) was incubated with fXIa (10 nM) (◆) in HBS/PEG/Ca2+ at 37°C and aliquots were removed every 30 seconds for fV activity analysis. Samples were diluted to 0.5 nM fV in 100 μL of fV-deficient plasma and subjected to a PT clotting assay. Clot times were transformed into relative fVa concentrations based on a fVa standard curve and normalized to percent activation compared to thrombin activated fVa. Data represent mean +/− SEM for two independent experiments.

