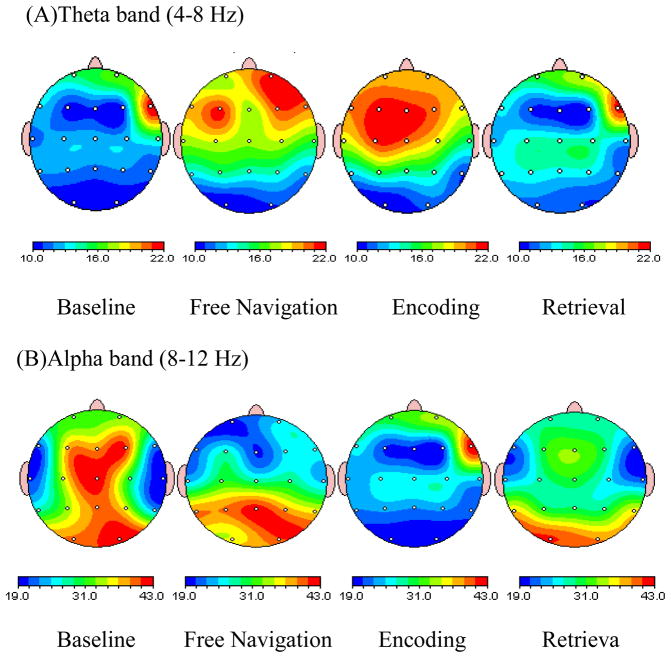
Fig. 3.
Brain maps showing topographical distribution of theta and alpha power during free navigation, baseline, encoding and retrieval of visual- spatial working memory task: (top) Brain map showing increase in theta power in right frontal and frontal-central region during encoding and free navigation as compared to retrieval. When encoding is compared with baseline, the increase is again significant in right frontal brain region. Another point of interest is higher theta power at frontal-central areas during free navigation as compared to retrieval; (bottom) Brain map showing a significant increase in alpha power in all the regions during baseline in comparison to encoding and retrieval. When comparing encoding and retrieval, alpha power is slightly higher during retrieval at right parietal, left central and left, right occipital brain regions. When comparing retrieval and free navigation, alpha power reduced at occipital areas. Overall, both encoding and retrieval attenuate alpha power at all ROI.

