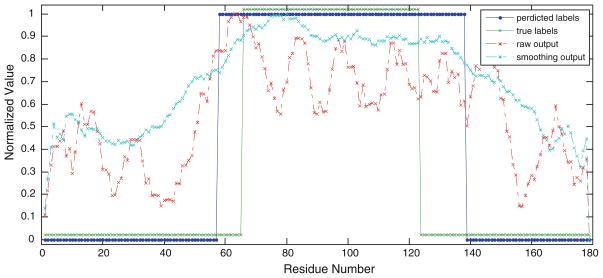
Fig. 3.
Comparison of raw and smoothing outputs from SVR model for protein chain 1qu6A. The protein chain has 179 residues and contains two domains lined by a domain boundary. The center of the domain boundary is at residue 94. The two types of outputs are normalized to the range [0, 1]. The two square curves denote the two kinds of residue labels. One is true labels describing residues’ states (boundaries/not boundaries); the other is predicted labels

