
Figure 4.
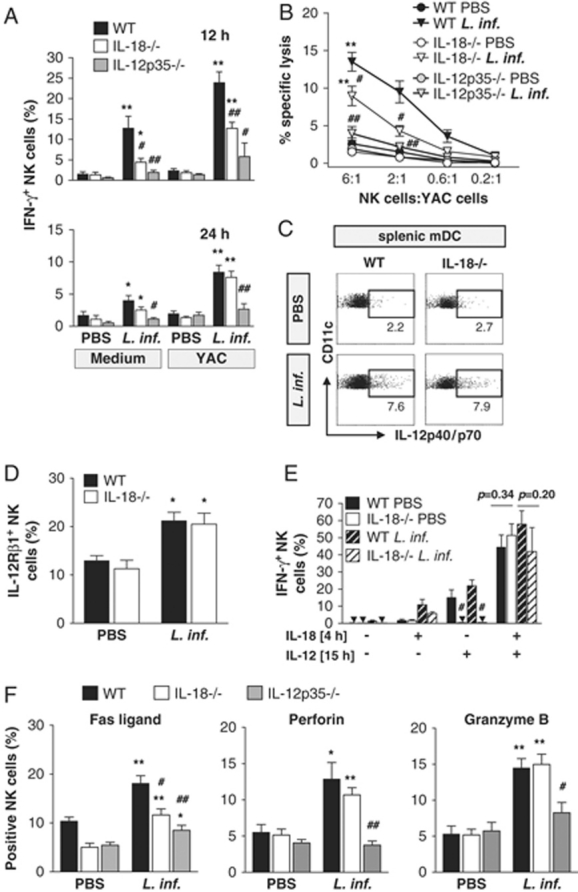
Mechanism of NK-cell activation by IL-18 in L. infantum-infected mice. At 12 and 24 h after i.v. injection of PBS or L. infantum promastigotes into C57BL/6 WT, IL-18−/− and IL-12p35−/− mice, splenocytes were prepared. (A) Frequency of IFN-γ+ NK cells (CD3−NK1.1+) as determined by intracellular cytokine staining and FACS analysis after a 4 h culture in medium or with YAC cells. Mean±SEM of six (WT versus IL-18−/−) and three (WT versus IL-18−/− and IL-12p35−/−) independent experiments with two to three mice per group. (B) NK-cell cytotoxicity at 24 h after infection. Mean±SEM of four (WT versus IL-18−/−) and three (WT versus IL-18−/− and IL-12p35−/−) independent experiments with two to three mice per group. (C) Intracellular IL-12p40/p70 protein expression of splenic mDC (restimulated in culture medium for 4 h; gated on CD11bintCD11chi cells) is shown in a dot plot analysis representative for three independent experiments with two to three mice per group. (D) Surface expression of IL-12Rβ1 on CD3-NK1.1+ NK cells directly ex vivo. Mean±SEM of three experiments with two to three mice per group. (E) Intracellular IFN-γ protein expression in NK cells from WT and IL-18−/− mice 12 h after infection or PBS treatment, which were cultured for 4 h (±IL-18), washed, and further incubated for 15 h (±IL-12). Mean±SEM of three independent experiments with two mice per group. (F) Surface expression of FasL and intracellular expression of perforin or gzmB of CD3-NK1.1+ NK cells directly ex vivo. FasL: mean±SEM of five (WT versus IL-18−/−) and three (WT versus IL-18−/− and IL-12p35−/−) experiments, two to three mice per group; perforin: mean±SEM of three experiments, two mice per group; gzmB: mean±SEM of four (WT versus IL-18−/−) and three (WT versus IL-18−/− and IL-12p35−/−) experiments, two to three mice per group. (A–F) Significant differences by Mann–Whitney test between cells from infected and PBS treated mice (*p<0.05; **p<0.002) and between WT and IL-18−/− or IL-12p35−/− (♯p<0.05; ♯♯p<0.005) are indicated.