
Figure 4.
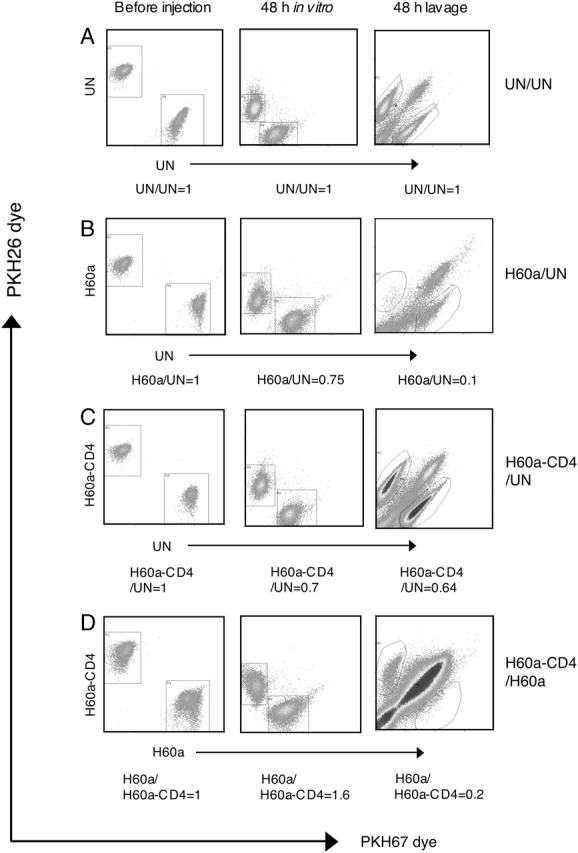
Elongation of H60a reduces lysis in vivo. The two indicated RMA cell populations were labelled separately with different membrane dyes, and injected at a 1:1 ratio i.p. into B6 mice. After 48 h, the peritoneal lavage was analysed by flow cytometry. Examples of the labelled cell populations analysed immediately before injection, after 48 h culture in vitro and in the peritoneal lavage are shown. (A) Untransfected RMA (UN) and untransfected RMA (UN). (B) RMA+H60a and untransfected RMA. (C) RMA+H60a-CD4 and untransfected RMA. (D) RMA+H60a-CD4 and RMA+H60a. Data are representative of four (A–C) and two (D) independent experiments, using two to four mice per group for each experiment.