Figure 2.

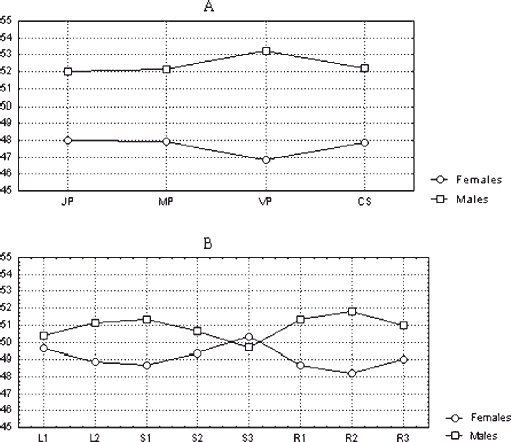
Profiles of women and men's performance in (A) the four VSWM tasks and (B) the eight orientation tasks. Values are reported in T points (mean = 50 and standard deviation = 10)

Profiles of women and men's performance in (A) the four VSWM tasks and (B) the eight orientation tasks. Values are reported in T points (mean = 50 and standard deviation = 10)