Fig. 4.

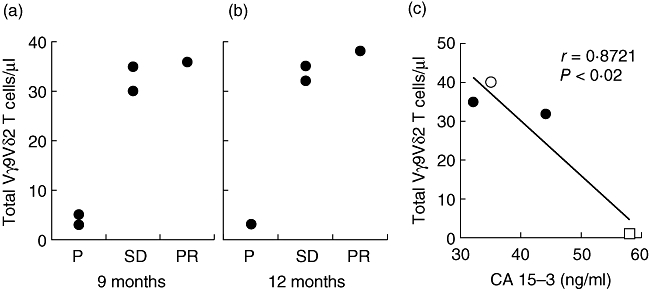
(a, b) Correlation between Vγ9Vδ2 T cell numbers and clinical outcome at T9 (a) and T12 (b). PD: progressive disease; SD: stable disease; PR: partial remission. (c) Inverse correlation between Vγ9Vδ2 T cell numbers and CA15-3 levels, as assessed at T12, in one patient with partial remission (open circles), two patients with stable disease (closed circles) and one patient with progression (open square).
