
Fig. 1.
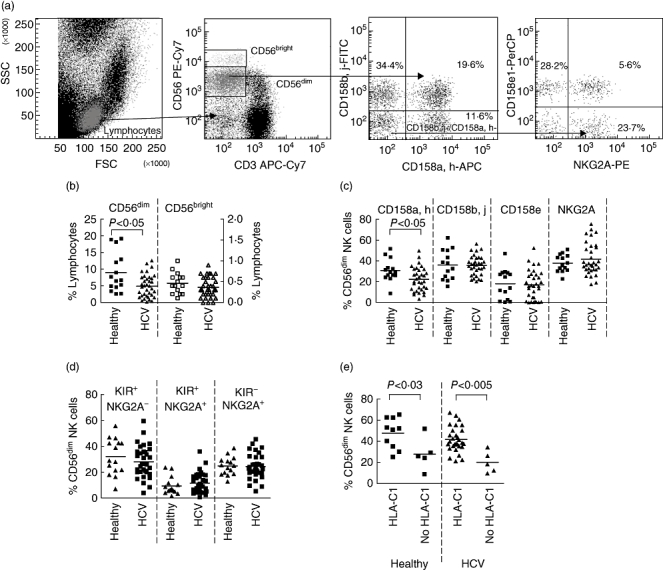
A comparison of CD3-CD56+ natural killer (NK) cells between hepatitis C virus (HCV)-infected individuals (squares) with healthy individuals (triangles) as determined by flow cytometry. (a) Strategy for the six-colour flow cytometry, gating on CD56dim, CD3- NK cells to determine killer-cell immunoglobulin-like receptors (KIR) (CD158a,h, CD158b,j and CD158e) and NKG2A expression. Shown are three dot plots demonstrating the expression of CD158e and NKG2A on CD158a,h-,CD158b,j-, CD3-CD56dim NK cells. (b) Percentage of CD56dim and CD56bright NK cells as a fraction of the total lymphocyte population. The CD56dim NK cells are recorded on the left axis (closed symbols) and CD56bright NK cells on the right axis (open symbols). (c) Frequencies of NK cells expressing individual major histocompatibility complex (MHC) class I receptors as determined by anti-CD158a,h (KIR2DL1/2DS1), anti-CD158b,j (KIR2DL2/2DL3/2DS2), anti-CD158e (KIR3DL1) and Z199 (NKG2A). The data shown are the percentage of total CD56dim NK cells expressing the indicated receptor. (d) Comparison of the overall frequencies of NK cells expressing receptors for which they have an MHC class I ligand (an HLA-B or HLA-C allele for the KIR, or HLA-E for NKG2A). (e) Frequencies of NK cells expressing a cognate HLA-C receptor in individuals with and without an HLA-C group 1 allele. Comparisons between the healthy donors and HCV infected individuals were performed using the Mann–Whitney U-test. P-values of 0·05 or less are indicated.