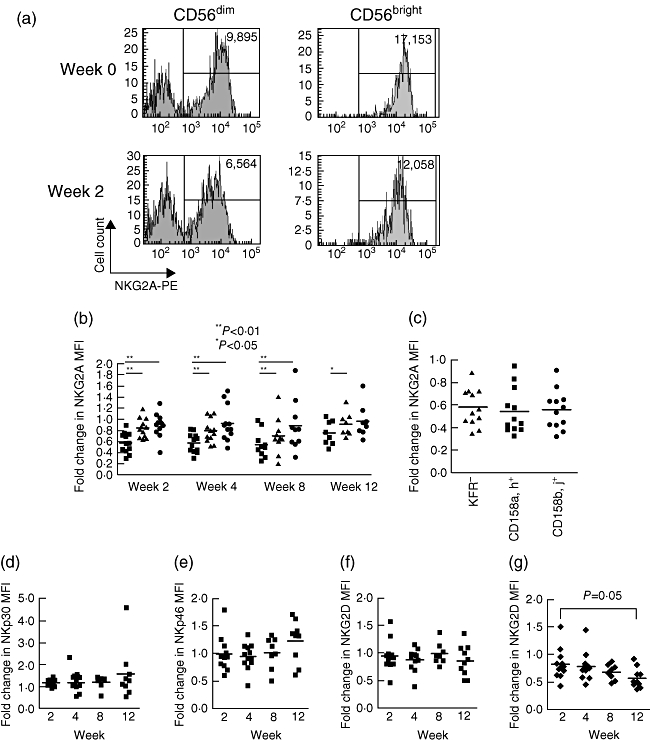
Fig. 3.

The effect of pegylated interferon and ribavirin on expression of inhibitory and activating receptors. (a) Flow cytometry plot of natual killer (NK)G2A expression pretreatment and at week 2 on CD3-CD56bright and CD3-CD56dim NK cells, showing the change in mean fluorescence intensity. (b) Fold change in mean fluorescence intensity of NKG2A on all NKG2A-positive CD56dim NK cells (squares), CD56bright NK cells (triangles) and CD3+NKG2A+ T cells (circles) during the first 12 weeks of therapy. The chart shows the comparison of the expression level of NKG2A at the indicated weeks compared to the baseline level. Expression of NKG2A declined most rapidly on the CD56dim NK cells compared to the CD56bright NK cells and CD3+ T cells. Statistical analysis was performed using the Wilcoxon matched-pairs test. (c) Fold change in NKG2A expression compared to baseline on the indicated subsets of NKG2A-positive CD56dim NK cells at week 2. (d–f) Fold change compared to baseline in the mean fluorescence intensity of the activating receptors NKp30 (d), NKp46 (e) and NKG2D (f) on CD56dim NK cells and of NKG2D on CD3+ T cells (g) during treatment.
