
Fig. 4.
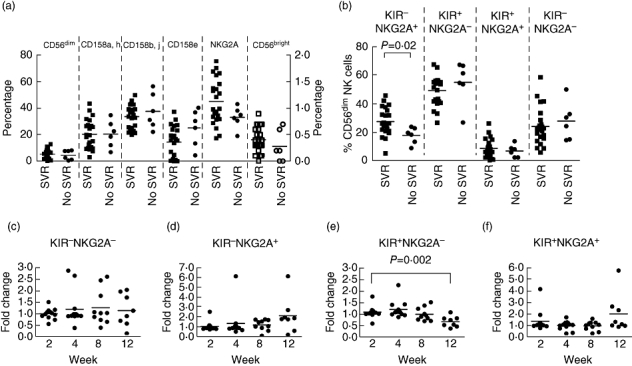
The association of sustained virological response to pegylated interferon and ribavirin with the frequency of specific subpopulations of natural killer (NK) cells. (a) Pretreatment frequencies of CD56dim NK cells expressing the indicated receptors in individuals with (filled squares) and without (filled circles) sustained virological response (SVR) plotted on the left Y-axis. Also shown are the frequencies of the CD56bright NK cells from the same individuals plotted on the right Y-axis (open squares denote individuals with SVR and open circles those without SVR). (b) Pretreatment frequency of CD56dim NK cells expressing the indicated receptors on individuals with (squares) and without (circles) SVR. Comparisons between those with and without SVR were made using the Mann–Whitney U-test. (c–f) changes in the indicated subpopulations of NK cells during treatment. Statistical comparisons were made using the analysis of variance (anova) test. For all panels P-values of less 0·05 are indicated.