
Fig. 2.
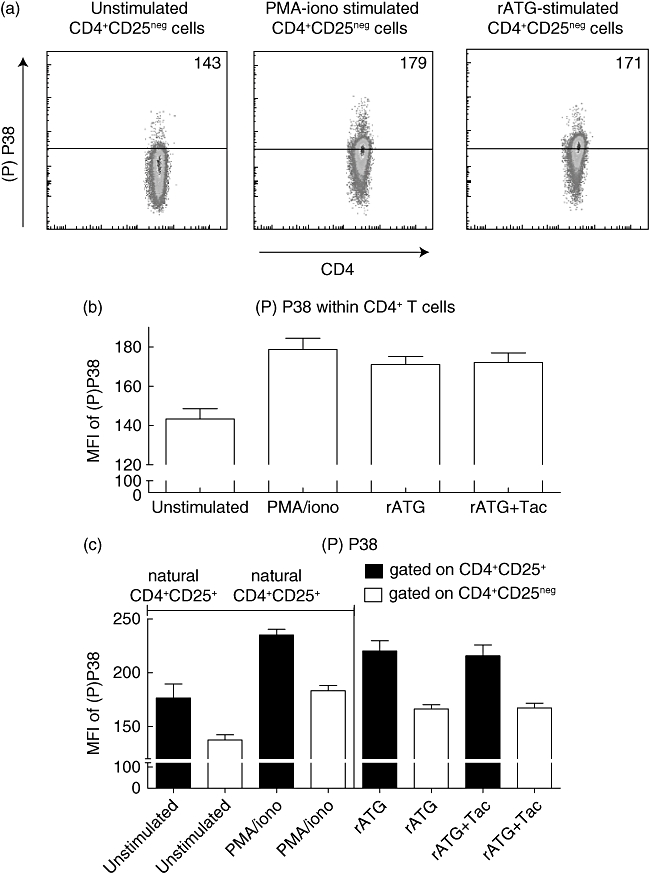
P38 phospho-specific flow cytometry. (a) Representative example of P38 phosphorylation levels in unstimulated, phorbol myristate acetate (PMA)–ionomycin-stimulated, rabbit anti-thymocyte globulins (rATG)-stimulated CD4+CD25neg cells. Median fluorescence intensities are depicted of phosphorylated P38 in CD4+ T cells after 24 h of culture. (b) P38 phosphorylation in unstimulated CD4+CD25neg cells, PMA–ionomycin-stimulated CD4+CD25neg cells, rATG-stimulated CD4+CD25neg cells and rATG–tacrolimus-stimulated CD4+CD25neg cells, n = 3. (c) phosphorylation of P38 in unstimulated and PMA–ionomycin-stimulated natural CD4+CD25+ (nCD4+CD25+) and CD4+CD25neg cells from PBMC and rATG-induced CD4+CD25+ and CD25neg cells.