
Fig. 3.
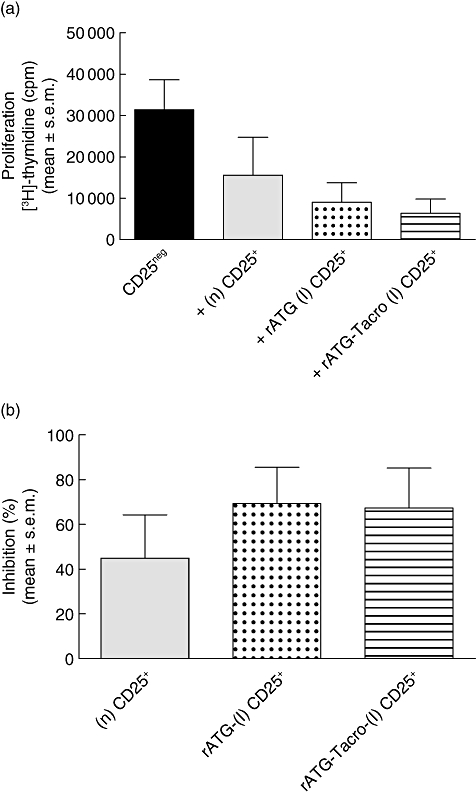
Suppression assays with natural (n) and rATG-induced (I) and rATG-tacrolimus-induced CD25+ T cells. (a) Proliferative responses after [3H]-thymidine incorporation are shown in counts per minute (cpm) of CD25neg T cells in response to alloantigen (black bar) and of CD25neg T cells in the presence of (n) CD25+ T cells (grey bar), rATG (I) (dotted bar) and rATG–tacrolimus-induced (striped bar) CD25+ T cells. (b) Percentage inhibition of the proliferation of CD25neg T cells by (n) (grey bar), rATG-(I) (dotted bar) and rATG–tacrolimus-induced (striped bar) CD25+ T cells. Mean ± standard error of the mean are shown for five healthy individuals.