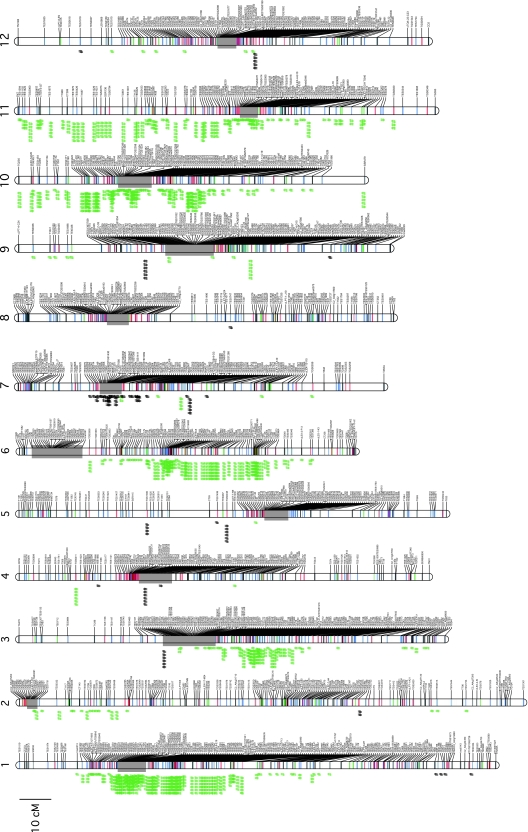
Fig. 1.
Genetic linkage map of the tomato genome. Twelve linkage groups were constructed using 634 TGS markers (red lines), 648 TES markers (blue lines), 151 TEI markers (green lines) and 683 reported markers (black lines). The gray box in each linkage group indicates the estimated heterochromatic region. The distorted loci are indicated by hatch symbols in green (increases in S. pennellii alleles) and black (increases in S. lycopersicum alleles), as determined using the Chi-square test (# P < 0.05, ## P < 0.01, ### P < 0.005, #### P < 0.001, ##### P < 0.0005 and ###### P < 0.0001). Scale bar 10 cM

