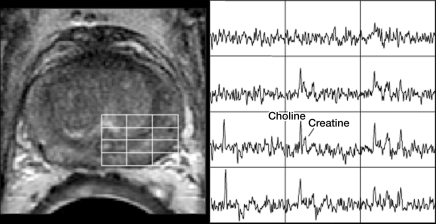
Figure 1b:
Biopsy-proven recurrent prostate cancer in left side of prostate in 60-year-old man. (a) Axial T2-weighted MR image shows findings consistent with posttreatment changes (arrow). (b) However, MR spectroscopic image clearly depicts areas of malignant metabolism (ie, increased choline peak relative to creatine level). Spectra from the line grid on the image (left) are shown at right.

