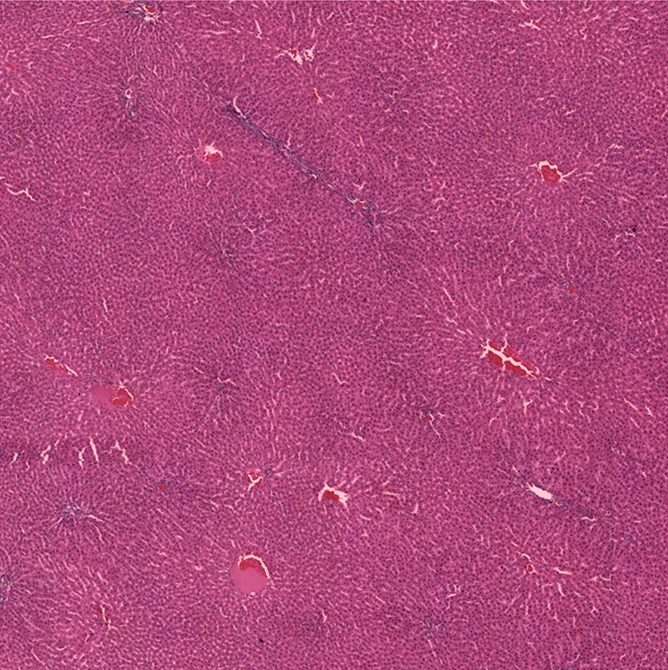
Figure 3b:

Representative H-E–stained histology slides for rats sacrificed (a, b) immediately and (c) 24 hours after 2500-V IRE procedures. (a) A low magnification image with a large field of view and (b) inset (white box in a) both show no clear morphologic changes but eosinophilic cytoplasmic changes in IRE ablation zone. Image c shows a well-delineated boundary between untreated and ablated tissues, with cellular necrosis in ablation zone. (Original magnification in a, ×2.5; in b and c, ×25.)
