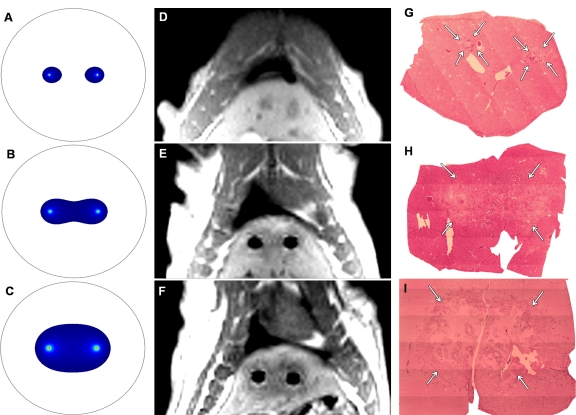
Figure 4:
A–C, FEM-anticipated IRE ablation zones; D–F, post-IRE T1-weighted GRE images; and G–I, corresponding H-E histology slides from livers harvested 24 hours after IRE. (Original magnification, ×2.5.) Top row: 1000 V. Middle row: 1500 V. Bottom row: 2500 V. MR images were acquired perpendicular to IRE electrodes, which were removed prior to (D) post-IRE MR imaging for 1000-V procedure. Note that increasing FEM-anticipated and T1-weighted ablation zone sizes parallel increasing ablation zone sizes (arrows on G–I) on corresponding histology slides.

