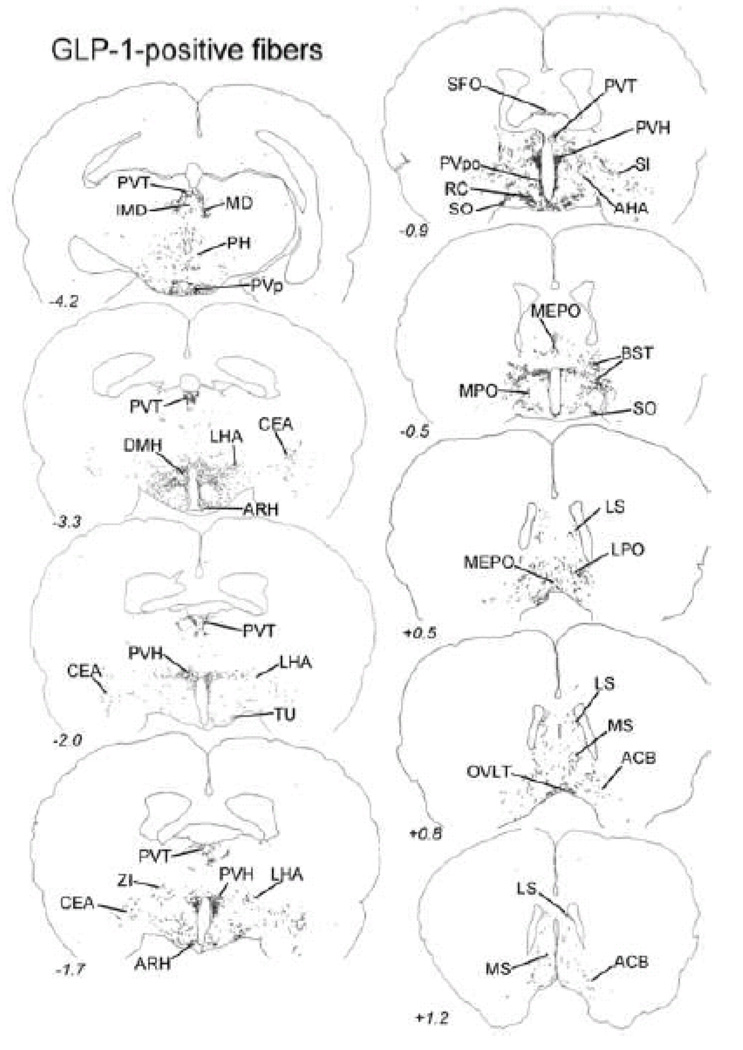
Figure 12.
Distribution of GLP-1-immunopositive fibers within the diencephalon and limbic forebrain. The approximate rostro-caudal level of each section (relative to bregma, in mm) is indicated, based on a standard rat brain atlas (Swanson, 2004). Top = caudal, bottom = rostral. See Table 1 for abbreviations.

