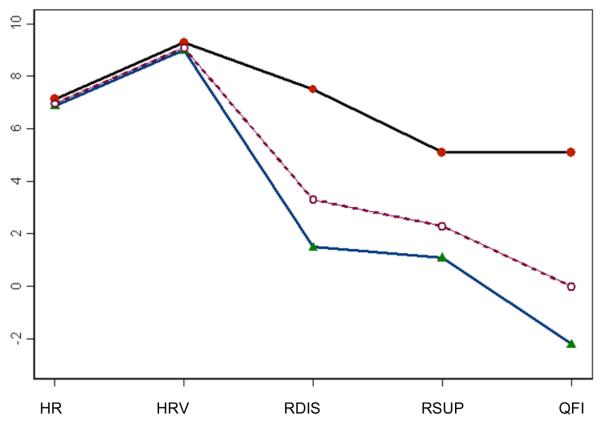
Figure 4. Profile plots of HR, HRV, alcohol use, and reasons for drinking by cluster groups.
The top solid line represents the High Alcohol Risk group and the bottom solid line represents the Normative group. The dotted line in the middle represents the average. HR = Mean heart rate, HRV = A 0.1 Hz heart rate variability index, RDIS = Disinhibition reasons for drinking, RSUP = Suppression reasons for drinking, QFI = alcohol quantity and frequency index.

