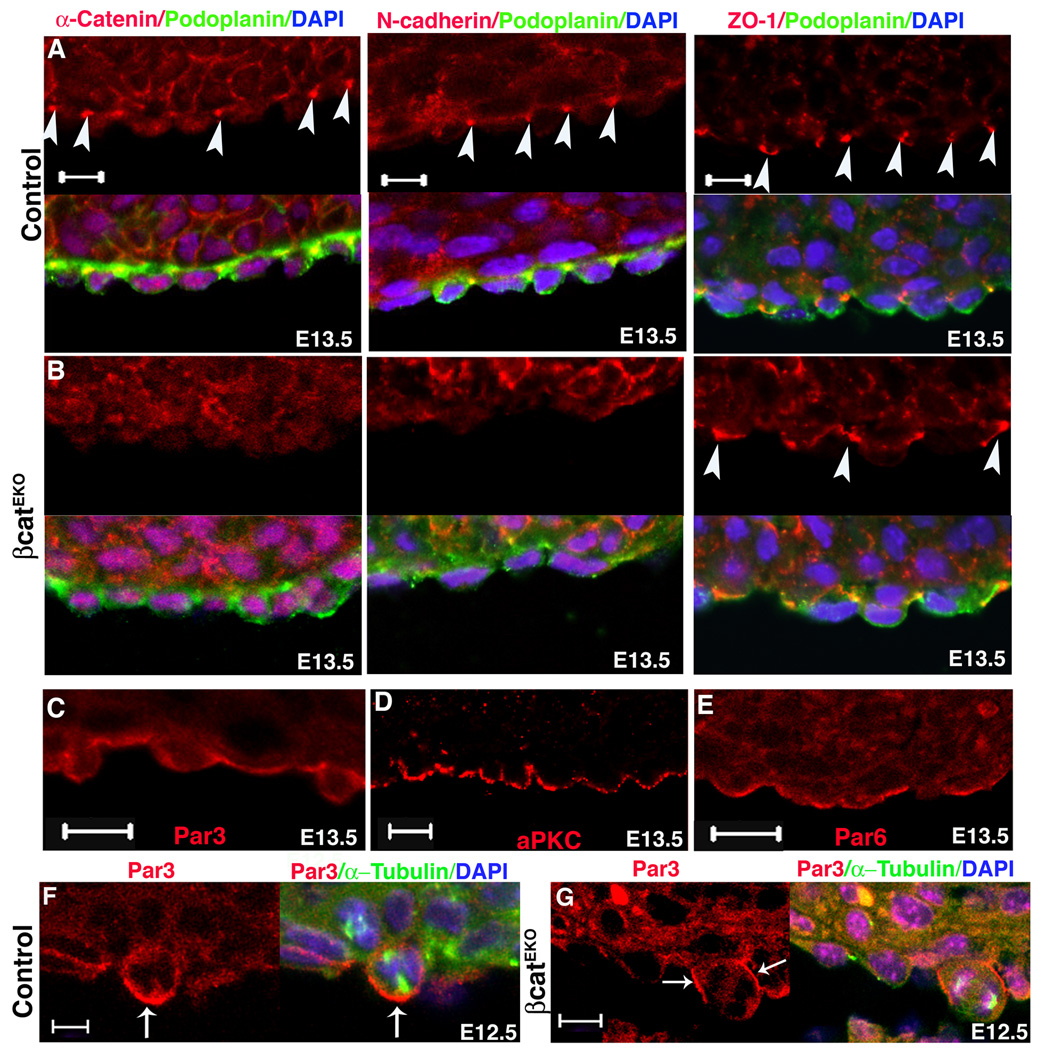
Figure 4. Epicardial cell junctions and polarity.
Formation of adherens junctions (α-catenin and N-cadherin) and tight junctions (ZO-1) in (A) control and (B) βcatEKO. Arrowheads point to the junctions. Podoplanin marked epicardial cells. (C–E). Wild type hearts were stained for the indicated cell polarity proteins. (F–G) Par3 localization in (F) control and (G) βcatEKO mitotic epicardial cells. Arrow indicates accumulated Par3. Scale bar = 10 µm.

