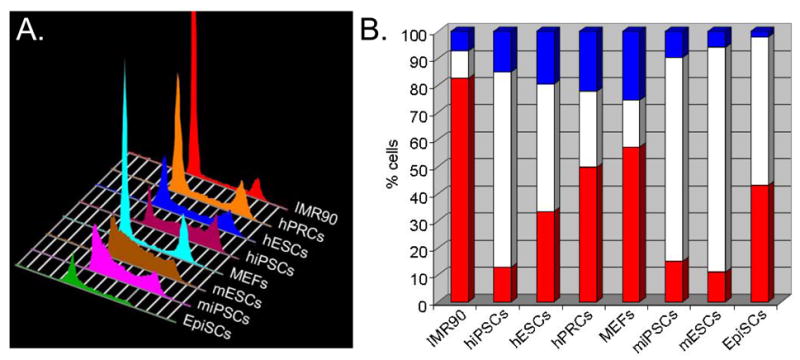
Figure 1. Cell cycle structure of human and murine pluripotent cells and fibroblasts.

This figure represents typical cell cycle profiles from a range of pluripotent cell types (mESC, hESC, miPSC, hiPSC and mEpiSC) and primary fibroblasts. Pluripotent cells spend a high proportion of time in S-phase cells and a low proportion of time in G1 (Savatier et al., 1996; Stead et al., 2002; Fluckiger et al., 2006; Ohtsuka and Dalton, 2008; Dalton, 2009; Neganova et al., 2009; Zhang et al., 2009). MEFs and human IMR90 fibroblasts show a lower % of cells in S-phase and an increased proportion in G1, relative to pluripotent cells. hPRCs display a cell cycle structure intermediate between differentiated fibroblasts and pluripotent cells. The positions of G1 cells (2n DNA content), S-phase cells and G2/M cells (4n DNA content) are indicated. The Y-axis represents the relative number of cells and the X-axis represents the DNA content of cells, a read-out for cell cycle position.
