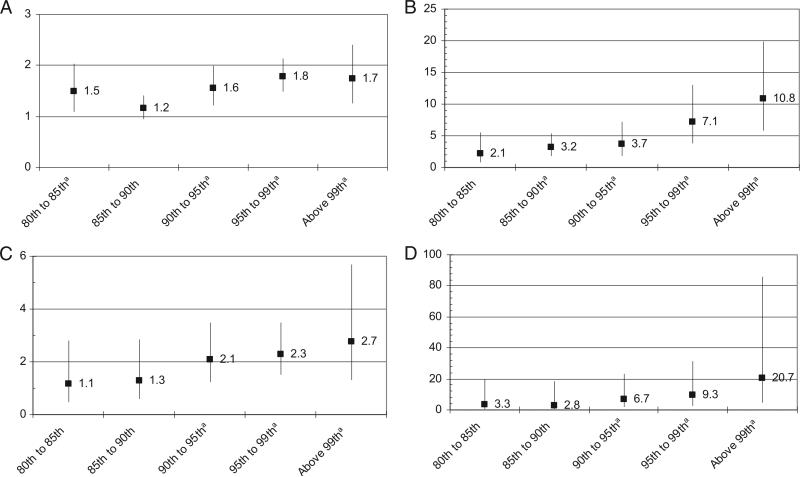
FIGURE 1.
Odds ratios and 95% confidence intervals from adjusted logistic regression of the effect of weight on likelihood of abnormal lipid values. a P < .01. A, odds of high or borderline total cholesterol; B, odds of low HDL cholesterol; C, odds of high or borderline LDL cholesterol; D, odds of high triglycerides.

